Jun 17, 2022
How to Present Information Better in XMind with VistaCreate

Jun 17, 2022
How to Present Information Better in XMind with VistaCreate
 Visual presentation is the best way to introduce your ideas to the audience, and mind maps serve as a great tool to organize and link those ideas for better visualization.
But if you want to take a step further and present your content with exclusive layouts, here goes a solution:
Combine a mind mapping technique with professional graphic templates.
This short guide reveals the benefits of visuals for user engagement and persuasion. You'll see how to structure the data into a more coherent, impactful flow with graphic designs from VistaCreate and mind mapping instruments from XMind for the audience to understand your points, step by step.
From informative guides and summaries to compelling infographics, lists, and project plans – we've got your imagination covered!
Why Mind Mapping With Graphic Templates
Regardless of the niche you represent, visual content attracts more attention and is easier to remember. It's more persuasive and engaging. It enhances emotions and affects the attitude of others towards you.
This effect of visuals is nothing but human psychology:
We know that most people are visual beings. Since 90% of information transmitted to the human brain is visual and 93% of all communication is nonverbal, no wonder we perceive visual information 60,000 times faster than text.
Such impressive numbers make mind maps, infographics, and other illustrative content a powerful tool for creating impactful visual presentations for your business and personal needs.
The chances are that you already know the nature of mind maps: They are diagrams with illustrations of a core topic in the center and all the related ideas around. Like this one:

Since humans don't organize information in a hierarchical order but build associations from different connection points in the brain, mind maps seem the most suitable way to replicate this process. By presenting information with mind mapping, you help the audience navigate your ideas, build connections faster, and see how they relate to each other.
Long story short: Mind mapping makes it easier for people to understand the info you want to deliver. With the help of a mind map that was professionally designed with an eye-catching graphic template, you get a highly effective tool for communicating with your targets.
Here's an example of a mind map from XMind to present the information about the product launch process:

And here goes an example of how the chemistry between graphics and mind mapping works. The mind map template library of VistaCreate has layouts for presenting different types of information with creativity and more haunting visibility.

Below you'll find the hint on how to combine the instruments of these two platforms for more effective mind mapping.
How to Present Information with XMind and Graphic Templates
There are a few ways you can try to present your information with mind mapping. From graphic design tools and drawing your map from scratch to presentation software and using a customizable template, – it's up to you to decide which method meets your needs better.
For creatives, project managers, marketers, and others with no stellar design skills, the most comfortable way to make a captivating mind map would be via handy tools like XMind. Just combine a relevant graphic template from VistaCreate with XMind's editing features – and voila!
Here go your steps to follow:
1) Pick a graphic template with your core idea in the center
VistaCreate introduces a massive collection of ready-made templates to consider for your mind map. Just visit their gallery and choose the most appropriate layout for your project.

With a mind map template at hand, you save time outlining your information. Consider a layout that will fit your topic best.
It can be a personal project like your work plan for a week, a map to building a new habit, a wishlist, or steps to increase productivity.
Or, you can take graphic templates for business and marketing projects such as creating a branding strategy, brand storytelling, business plans, or content matrix for publications on your blog.
As a rule, mind map layouts place the main topic at the center. Such templates are great for presenting a few concepts with many related subtopics growing from your central idea: They provide more space for all the other elements.
However, if you want to present only one concept and its branches, you can choose a VistaCreate template with a primary idea on the left of your mind map, with enough space to develop related subtopics on the right.

You can also try to craft your mind map like a quiz, use an animated mind map template, or present it as an infographic. XMind displays the corresponding instruments for designing such visuals on different devices.
2) Brainstorm related ideas and create branches in your map with XMind
Now that you have a graphic template for presenting your information, it's time to fill it out. You'll need to come up with core points related to your central claim and put them inside the corresponding places of your mind map.
The most efficient method here is through organizing a successful brainstorming session.
It will help you create so-called branches in your mind map. These branches are those related to the ideas of your central claim, and they'll serve as the second level of your information for the audience to learn.
With the help of a drag-and-drop editor in XMind, you can replace branches, change their number and size, remove redundant information, etc.

When brainstorming, remember that mind maps are about visual presentation. Use keywords and short phrases, and avoid content-heavy descriptions of your idea.
3) Connect supporting details to your map's branches
The next step would be to identify supporting details for each branch of your mind map and put all these levels of information together.
Explore your main ideas further and divide them into so-called sub-branches, with more components for your audience to understand all the aspects of your topic.

There's no limit to the number of supporting details you can add to each branch, but make sure you don't overwhelm your mind map. Otherwise, you'll confuse the audience, and your information will become challenging for them to perceive.
Once you've got all the ideas and supporting details in your mind map, it's time to connect them: Add lines from the central idea to branches and corresponding sub-branches to visualize all the connections and make it clear for the audience to navigate.
You need to tie all the elements together into a cohesive unit. Features like blocks, arrows, lines, and other navigational ones in XMind will help with that.

4) Add visuals to your design
Thanks to such a diversity of graphic template tools as VistaCreate represents, mind mapping can be not only about the schematic representation of your words. Visuals are also critical because they work as memory triggers for the audience to get engaged and remember the information.
To make your mind map as memorable as possible, add icons, colors, and images to its design.
With XMind, you can unleash creativity and use features like Stickers, Illustrations, Floating Topics, and Markers to support your mind map with bright details. You can also capture your work with Map Shot, for more people to see it!
You can choose corresponding images from the gallery in XMind or upload your own collection using the editor. Here go some tips to consider:
● Use different colors for different branches of your mind map. You'll separate and coordinate ideas visually this way, showing the organization of your information and making your map look more appealing. Like in this example:

You can also use different colors when showing cross-linkages between the parts of your mind map. It will help the audience see how one branch (idea) affects or relates to another.
● Add icons, symbols, and images. Such elements are more efficient than words to remember, and they work as hooks for the audience to navigate the information you're trying to provide.

● Avoid complex words and sentences when describing your mind map's branches and sub-branches. Short, meaningful phrases are more expressive and convincing than content-heavy writing ideas; think of power words and design them with different font sizes and colors to visualize the hierarchy of your ideas for the audience.
5) Present it as a slideshow for even better visualization
Once your mind map is ready, you can download it to your computer as a PNG or PDF file for usage or printout. You can also save it as a Microsoft PowerPoint file to integrate into your presentation later.
Or, you can go further and present it as a slideshow by playing it in the browser directly:
Takeaways
Mind mapping is one of the best strategies to present information to your audience. Maps are visual, engaging, and easier for people to perceive and remember your information better.
With XMind and the collection of graphic templates for mind mapping covered in this post, you can craft appealing visuals others will enjoy and follow. So why not give it a try right now? Choose a template – and start brainstorming and organizing your ideas into valuable information to present to your audience.
Let this post serve as the inspiration for crafting your new, compelling mind map today! Happy mind mapping :)
Reference:
More Posts
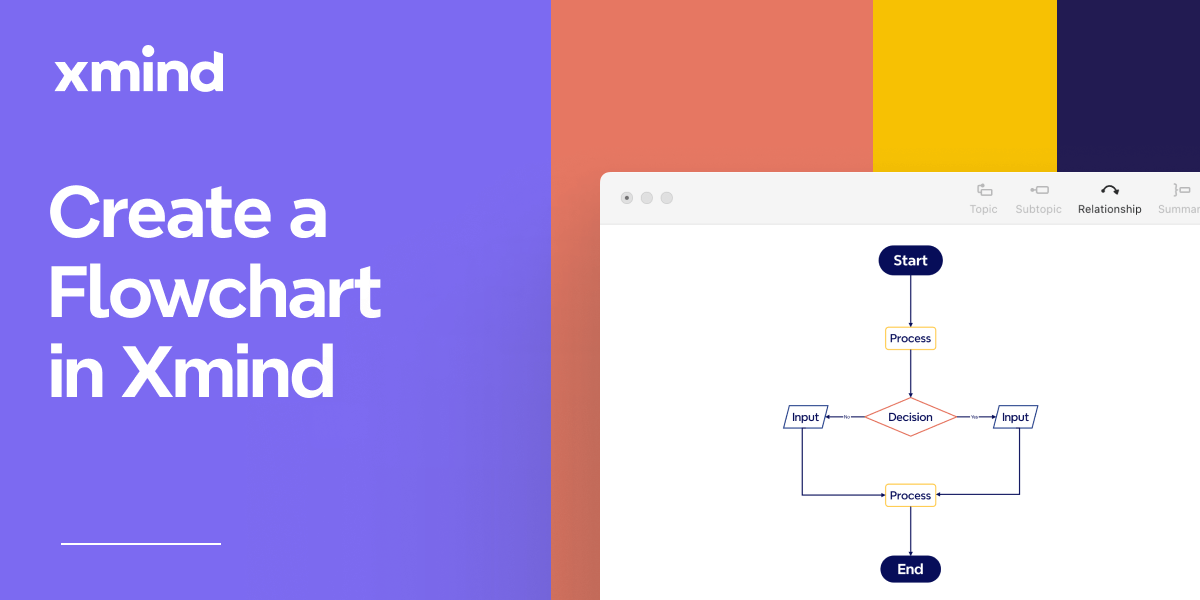
Flowchart Essentials: Definition, Templates, and Free Softwares
Discover the power of flowcharts with our detailed guide. Learn what a flowchart is, explore practical use cases, and discover how to create and optimize them using softwares like Xmind and Xmind AI for enhanced workflow efficiency.

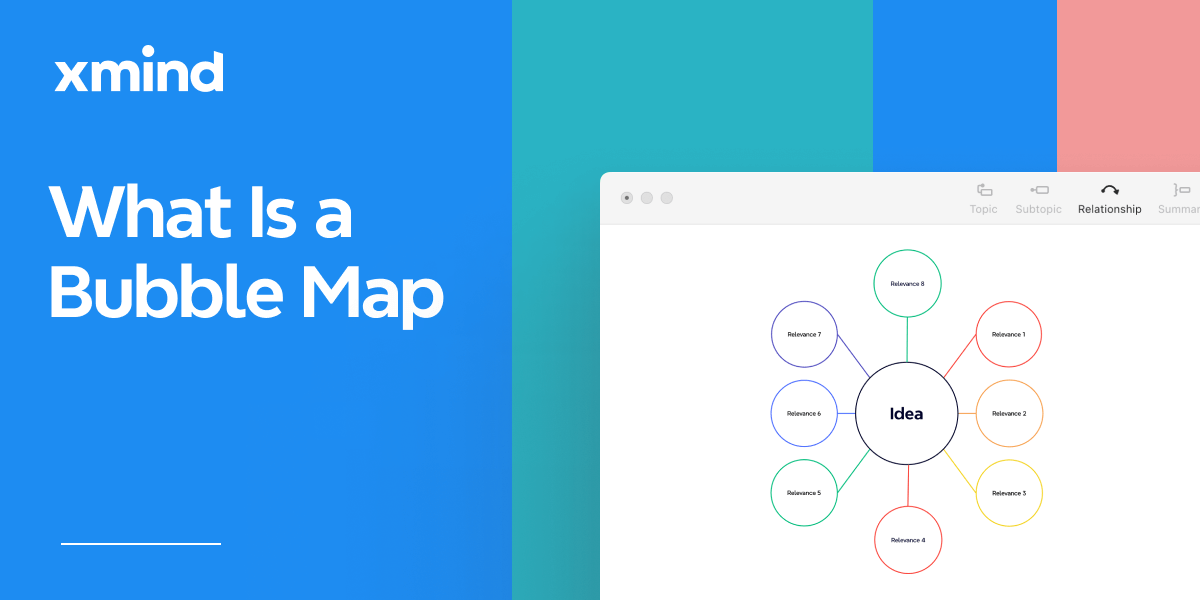
Bubble Maps: Definition, Examples, and How to Create in Xmind
Discover the power of bubble maps for data visualization with our comprehensive guide. Learn about different types, practical applications, and best mind mapping tools like Xmind. Get step-by-step instructions and expert tips to create stunning bubble maps for brainstorming, project management, and report writing.

The Plan-Do-Check-Act (PDCA) Cycle, Explained (+Mind Map Examples of PDCA)
PDCA is a simple yet effective methodology that can help you improve your work processes and get better results. By following the cycle's four steps - Plan, Do, Check, and Act - you can achieve continuous improvement in your operations, leading to better quality, increased efficiency, and greater customer satisfaction. Xmind is a great tool for implementing the PDCA model.


One space for all your ideas
Organize thoughts, visualize structures, connect ideas, and unlock insights.
Get Started for Free


