Bubble Maps: Definition, Examples, and How to Create in Xmind
Jul 17, 2024
Bubble Maps: Definition, Examples, and How to Create in Xmind
Jul 17, 2024
Data visualization is essential for presenting complex information. Bubble maps are a powerful tool for this, using bubbles to represent data points and making it easy to compare values and identify patterns. Whether you're brainstorming, breaking down project tasks, or writing reports, bubble maps can simplify your data presentation. In this blog post, we'll explain what bubble maps are, their benefits, the differences between bubble maps and double bubble maps, and how to create them using Xmind. We'll also share tips to make your bubble maps effective and visually appealing.
What Is a Bubble Map?
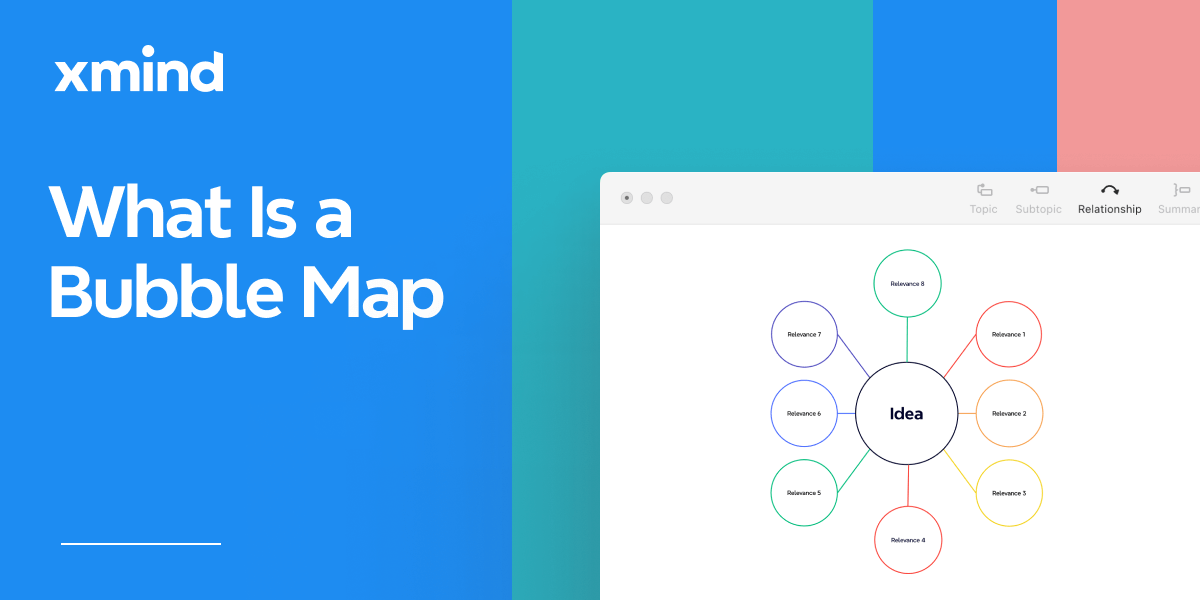
A bubble map is a simple visual tool that uses circles or bubbles to organize and display information, ideas, or data visually. It’s great for brainstorming, comparing concepts, or showing connections between ideas in a clear and easy-to-understand way.
Each bubble's size is typically proportional to the value it represents, making it easy to compare different data points at a glance. Bubble maps can be used to show relationships, hierarchies, and patterns within a dataset, providing a visually engaging way to present complex information.

- Clarity: Bubble maps present data in a clear and visually appealing manner.
- Comparison: They allow for easy comparison between different data points.
- Engagement: The visual nature of bubble maps can make presentations more engaging and interesting.
- Versatility: Bubble maps can be used in various fields, including business, education, and geography.
Bubble Maps vs. Double Bubble Maps
Bubble maps come in different types, with the two most common being bubble maps and double bubble maps.
Bubble Maps: Standard bubble maps use a single set of bubbles to represent data points, with each bubble's size proportional to its value. These maps are ideal for visualizing data in business analysis, geography, education, and project management.
Double Bubble Maps: Double bubble maps, on the other hand, use two sets of bubbles to compare and contrast two different sets of data. This type of map is particularly useful for showing relationships and differences between two datasets.

When You Need Bubble Maps and Templates
Bubble maps are versatile tools that can be used in a wide range of scenarios. Here are some key applications where bubble maps can be particularly useful:
Breaking Down Project Tasks
When managing complex projects, breaking down the tasks into smaller, manageable parts is crucial. Bubble maps provide a clear and organized way to visualize the project structure. By representing each task as a bubble, you can illustrate the relationships and dependencies between tasks. This not only helps in planning and assigning tasks but also in identifying potential bottlenecks and ensuring that all aspects of the project are covered. Bubble maps make it easier to communicate the project plan to team members and stakeholders, providing a clear overview of the entire project at a glance.
Brainstorming
Bubble maps are excellent for organizing and visualizing ideas during brainstorming sessions. They help in capturing and structuring thoughts more effectively by allowing you to create visual representations of your ideas. By placing the main idea at the center and branching out related sub-ideas as bubbles, you can easily see connections and generate more creative solutions. This visual approach helps in overcoming creative blocks and promotes a free flow of ideas. Moreover, bubble maps make it easier for teams to collaborate and build upon each other's ideas, ensuring that no valuable input is overlooked.
👉 Start to create a bubble map template with Xmind.
Writing Reports
Writing a detailed and structured report can be a daunting task. Bubble maps assist in outlining and organizing the report's content, making the writing process more manageable. By using a bubble map, you can visually arrange the main sections and sub-sections of the report, ensuring that all key points are covered. This helps in maintaining a logical flow of information and makes it easier to highlight important data and insights. Additionally, bubble maps can be used to illustrate complex concepts and data within the report, enhancing readability and comprehension for the audience.
Best Free Tools to Create Bubble Maps
Several free tools can help you create bubble maps, with Xmind being one of the most popular options.
- Abundant Skeletons: Xmind offers a variety of pre-designed templates to jumpstart your bubble map creation. These templates are fully customizable, saving you time and effort by providing a ready-made structure that you can adapt to fit your specific needs.
Floating Topics: Xmind allows users to add floating topics, which are independent bubbles not directly connected to the main structure. This is particularly useful for brainstorming and adding extra notes or data points, offering a more comprehensive visualization.
Collaboration Features: Xmind AI supports real-time collaboration, allowing multiple users to work on the same bubble map simultaneously. This is ideal for team projects, ensuring seamless idea sharing and collective development of maps.
Cloud Sync: With Xmind AI, you can sync your bubble maps across devices using cloud storage. This feature ensures that your work is always backed up and accessible from anywhere, allowing for consistent and flexible creation and editing on the go.

How to Create Bubble Maps in Xmind
We are going to use only 2 features to create bubble maps: Topic Shape and Relationships.
Bubble Map
Bubble Map is similar to the mind map structure. Both of these structures are started with central ideas and connected to different ideas, so let’s start in the Format panel.
- Go to Format panel and select the pre-designed mind map skeleton.

- Change the Topic Shape for central and main topics in Format panel.
- For making outside surrounded bubbles, we need to use Floating Topic and adjust the map layout in Format panel.
- Change the color of topic and texts, or move the topics, and we are all set.
You can also build Bubble Map on mobile devices following the guides above. We would love to suggest you to build Bubble Map on tablets, which is easier and faster.
Double Bubble Map
Let’s keep building this based on the Bubble Map above.
- Create a floating topic, copy and paste the style from the previous bubble map.
- Choose the structure. Use shortcuts Tab and Enter to add subtopics, and set topic shapes for them.
- Add relationships to connect the bubbles in the middle, the same way when making Bubble Map. Style colors, and texts, lines, etc. You can also add more topics to the new bubble too.
Best Practices and Tips
- Keep It Simple: Avoid cluttering your map with too much information. Focus on the most important data points.
- Use Color Wisely: Use colors to differentiate between different data sets or categories. However, avoid using too many colors, as this can make the map confusing.
- Label Clearly: Ensure that all bubbles are clearly labeled to avoid confusion.
- Check for Accuracy: Double-check your data to ensure that the bubble sizes are proportional to the values they represent.
By following the step-by-step guide and best practices outlined above, you can create professional-looking bubble maps in Xmind that will enhance your presentations and reports. 👉 Try today and experience the benefits of bubble maps for yourself.
Try Xmind Free