Mind Maps and Thinking Maps: A Guide to Boost Your Brainpower
Dec 16, 2022
Mind Maps and Thinking Maps: A Guide to Boost Your Brainpower
Dec 16, 2022
Have you ever thought that you could mind-map more than just mind-mapping——I mean, more than just mind-mapping? Well, I have, and I have learned the skill, which brought my creativity and efficiency to another level, with 8 easy cognitive tricks, and with a tiny little investment in time.
The secret is... The Thinking Map!
Created by David Hyerle. This guy converted eight different thinking processes into eight visual graphical languages. While those maps seem like mind maps, while there is some sort of correlation, and a lot of distinctiveness.
Imagine you have to present a new project to your coworkers. You pull out a visual map with tons of information scattering around the display. You have got 18 branches or more that prove you have been working quite a long time on it.
So? What about it?
Your information is not demonstrated on the map, and your message is not sent to the audience. When it comes to explanatory and demonstrative assessments, your maps should better be interpretative and logical. Even as in individual tasks, cognitive thinking while mapping can also enhance the overall results.
Below is the compare and contrast chart of mind map vs thinking map.
 Reading till the end to explore all 8 thinking maps. You will see how thinking maps can help visualize and abstract your thoughts with concrete visuals. There are eight types of thinking maps representation based on users' different purposes. Each thinking map requires cognitive skills and strong logical thinking. This method of learning helps learners to organize their ideas and information effectively.
Now is the real show time.
1: Circle map
Applied situations: Brainstorming
A circle map is an effective approach for learners to understand a rapid assessment. The structure of a circle map consists of two circles: a smaller circle inside a bigger circle. The small circle is the discussion topic or concept. The larger circle is filled with definitions or expressions of the discussion topic.
The circle map is always used for connecting ideas and opening information about the topic.

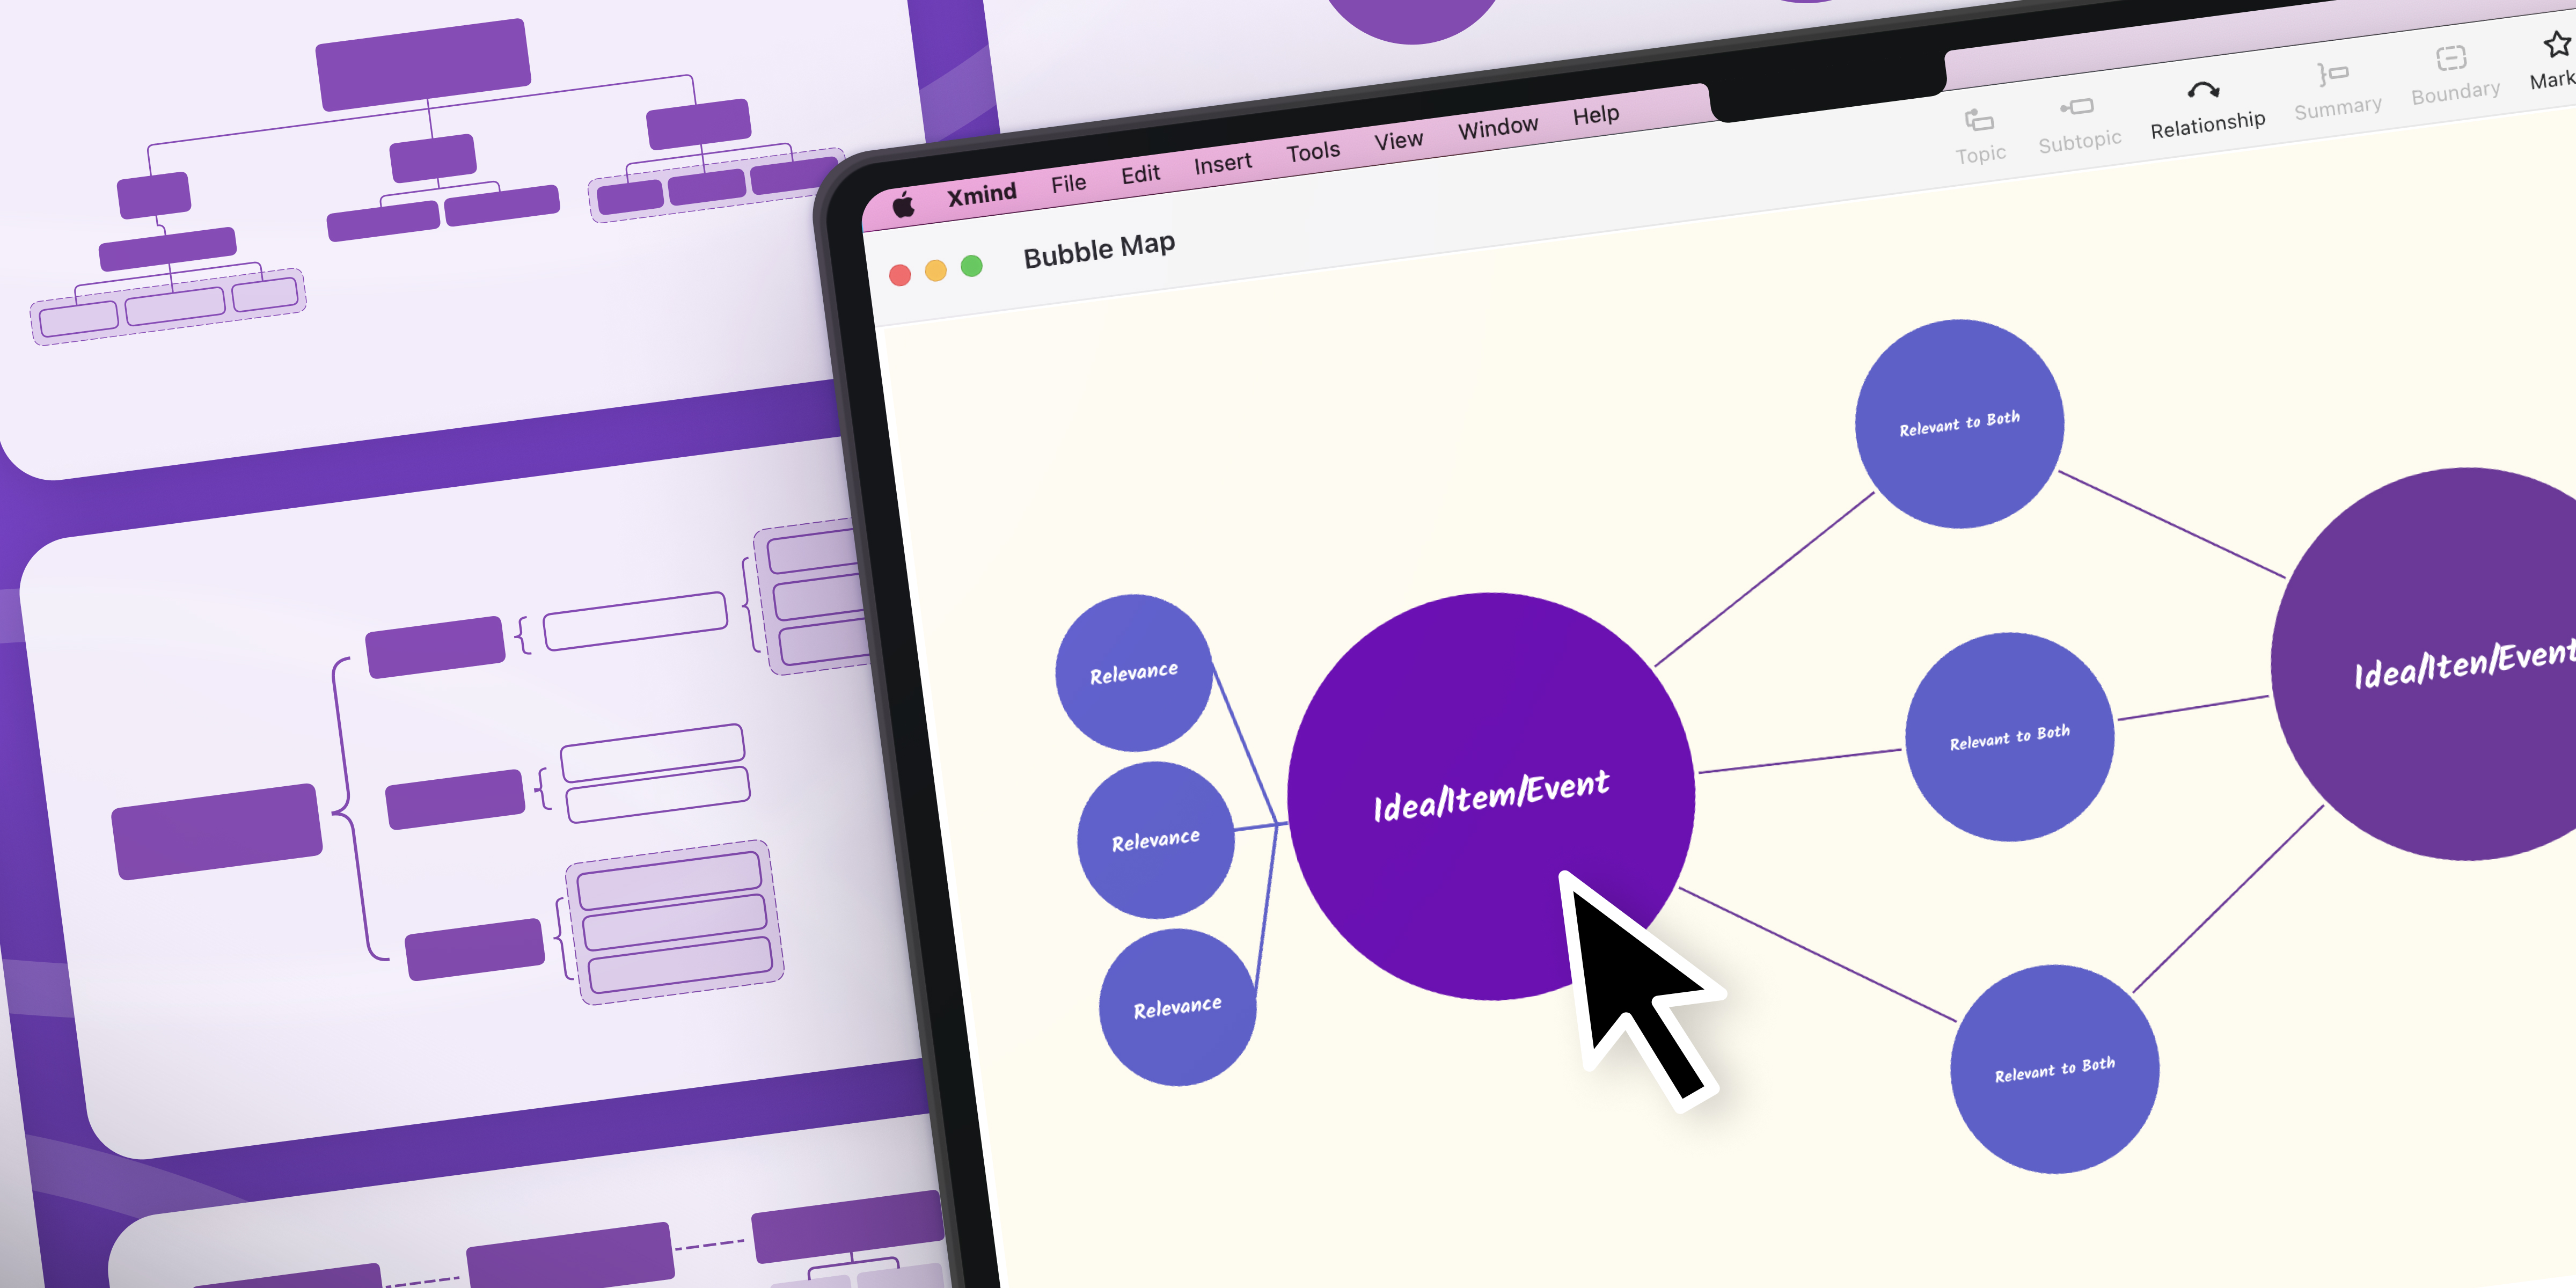
2: Bubble map
Applied situations: Describing subjects
When you are asked to define or describe a subject. Go for bubble map. A bubble map's structure is created by a central bubble with the object's concept written inside it. The outside circles would contain the phrases or adjectives that describe the objects. This will encourage learners to think more deeply about a given topic.

3: Double Bubble Map
Applied situations: Comparing and contrasting
Double Bubble Maps are handy for pinpointing similarities and differences between two things or concepts. The structure of a double-bubble map consists of **two big symmetrical circles with the objects being compared. **The surrounding circles comprehend the information of the two objects. The central circles that connect to both objects are the similarities. The rest of the circles that only connect to either object are the differences or uniqueness.

4: Flow Map
Applied situations: Ordering and sequencing
A flow map can be used to help learners plan and organize a series of events. A flow map is a visual representation of how things are interconnected. It helps to visualize the steps involved in a process or cycle. They could also help people get access to destinations or entrances by providing step-by-step directions.

5: Multi-Flow Map
Applied situations: Analyzing cause and effect
Multi-Flow Maps are a great mind map for visualizing cause-and-effect relationships.These maps help learners understand a concept by seeing its results. The structure of multi-flow map is created by drawing a rectangle in the center and labeling it with the name of the event that took place. On the left-hand side of the rectangle would contain a list of reasons for the event. On the other hand, on the right-hand side of the rectangle would illustrate the results for the event.

6: Brace Map
Applied situations: Identifying the whole to parts components
The brace map helps to visualize the relationships between different parts of a subject, and it has a tendency to organize and conceptualize the components of the whole topic. The structure of the Brace Map is created by setting an object on the left, sub-parts of the previous parts are expanded in descending order to the left.

7: Treemap
Applied situations: Classifying and grouping
The Treemap approach is a great way to sort and group objects, ideas, people or events. Tree maps are visualizations that help to sort information by using a main topic or category, with subordinate categories below it. Essentially, each subcategory contains members or items related to the group above it in the hierarchy.

8: Bridge map
Applied situations: Finding analogies
The bridge map allows users to find commonalities and linkages between objects by placing two concepts or objects next to or near each other. The structure of the bridge map is to create a bridge-like pathway. Analogical skills are crucial in this instance because people learn best when they can tie new information to something they already know.

And Yeahhh, all maps can be combined creatively. Even mind maps can correlate with thinking maps as well.
Go ahead and let your maps shine!
Reference
https://kern.org/alted/staff-resources-2/thinking-maps/
Try Xmind Free