
Sep 23, 2024
What Is a Venn Diagram: Definition, Applications, and Examples
Sep 23, 2024
What Is a Venn Diagram: Definition, Applications, and Examples

A Venn diagram is a simple tool that uses overlapping circles to show relationships between different groups. The areas where circles overlap show what the groups have in common, and the non-overlapping areas show their differences. Venn diagrams are often used in math, education, and business to help compare and understand information. With Xmind and Xmind AI, creating these diagrams is quick and easy, allowing you to customize them to fit your needs. for their powerful features and user-friendly interface.
What Is a Venn Diagram, and Typical Symbols?
Definition
A Venn diagram consists of circles that represent different sets. Each circle overlaps with one or more other circles, demonstrating the common elements between the sets. The areas where the circles overlap represent the intersection of the sets, while the areas that do not overlap represent the differences.

Venn Diagram Symbols
Venn diagrams use various symbols to represent the relationships between sets. Understanding these symbols is crucial for accurately interpreting and creating Venn diagrams.
- Set (A, B, C, etc.): Represented by circles or ovals, each set contains a group of elements.
- Subset (A ⊆ B): Indicates that all elements of set A are also elements of set B.
- Universal Set (U): Often depicted as a rectangle surrounding all the circles, representing all possible elements in the context.
- Intersection (∩): Symbolizes the common elements between sets.
- Union (∪): Represents all elements in either set.
- Complement (A'): Denotes elements not in a particular set.
- Empty Set (∅): Represents a set with no elements.

Venn Diagram Benefits
Venn diagrams offer numerous benefits, making them a popular choice for visualizing data:
- Simplification: They simplify complex relationships, making data easier to understand.
- Comparison: They highlight similarities and differences between sets, aiding in comparison.
- Problem-Solving: They help identify commonalities and unique attributes, useful in problem-solving and decision-making.
- Communication: They provide a clear, visual way to communicate ideas and findings.

Venn Diagram Makers
Many tools can help you create Venn diagrams efficiently, among which Xmind & Xmind AI are highly recommended.
Xmind is a popular mind-mapping tool renowned for its flexible operations and user-friendly interface. One of its standout features is the Floating Topic, which is particularly useful for creating Venn diagrams. This feature allows users to easily add and position topics anywhere on the canvas, making it simple to illustrate overlapping sets and their relationships.
Additionally, Xmind offers a variety of customization options, such as adjustable colors, shapes, and fonts, ensuring your Venn diagrams are both visually appealing and informative.
For team collaboration and real-time presentation of your diagrams, Xmind AI is the superior choice. It enables seamless co-working with team members, allowing everyone to view and edit diagrams simultaneously. This real-time collaboration ensures that all team members are on the same page and can contribute effectively, making Xmind AI an invaluable tool for collaborative projects.
Of course, there are more tools you can choose like Lucidchart, Canva, and Google Drawings, which offer ease of use and various templates to simplify your work.
Venn Diagram Examples and Templates
Venn Diagram in Mathematics and Statistics
Venn diagrams are frequently used in mathematics to illustrate the relationships between different sets of numbers or elements. For example, a Venn diagram can show the intersection of even numbers, prime numbers, and multiples of a certain number. This visual representation helps in understanding concepts like unions, intersections, and complements in set theory. Mathematicians and educators use Venn diagrams to explain these concepts clearly and effectively.
In statistics, Venn diagrams visually depict probabilities and relationships between events, illustrating concepts like joint and conditional probability, and event independence, aiding in data analysis, research, and probability theory.
Venn Diagram in Marketing Analysis
Marketing professionals use Venn diagrams to analyze market segments, identify target audiences, and compare product features. For example, a company might use a Venn diagram to compare the preferences of different customer groups, identifying overlapping interests and unique characteristics. This helps in tailoring marketing strategies to specific segments and finding opportunities for new product development. Venn diagrams provide a clear, visual representation of market data, aiding in strategic decision-making.
Venn Diagram in Education
Educators use Venn diagrams as teaching tools to help students compare and contrast different concepts. For example, in a literature class, a Venn diagram can compare the themes and characters of two novels. In science, it can show the similarities and differences between two species or chemical reactions. Venn diagrams make learning interactive and engaging, helping students visualize and retain information more effectively.
How to Create a Venn Diagram in Xmind & Xmind AI
Creating a Venn diagram in Xmind or Xmind AI is straightforward:
- Open Xmind or Xmind AI: Start the application and start to create a new mind map.
- Add Floating Topics: Double click on the canvas to freely create floating topics as different Sets.
- Customize: Edit your sets and customize the labels and colors as needed. Please set the filling colors of the sets to approximately 20% saturation.

- Save, Export and Share: Save your work and export it in your desired formats. Or, share it with your team members in Xmind AI using the collaboration feature.

How to Create a Venn Diagram in Google Docs
- Insert Drawing: Go to Insert > Drawing > New.
- Draw Circles: Use the shape tool to draw your circles.
- Customize: Adjust the colors and overlaps.
- Insert Text: Add text boxes to label your diagram.
How to Create a Venn Diagram in Google Slides
- Insert Drawing: Go to Insert > Drawing > New.
- Create Circles: Use the shape tool to draw your circles.
- Customize: Adjust the circles' size, color, and overlap.
- Label: Insert text boxes to label your diagram.

Whether you're a student, educator, or professional, understanding how to create and use Venn diagrams can greatly enhance your analytical and communication skills. With the right tools and templates, you can easily incorporate Venn diagrams into your work and presentations.
We highly recommend trying Xmind & Xmind AI for creating Venn diagrams, as they offer intuitive interfaces and robust features to make your diagrams both professional and visually appealing. Start using Xmind today and unlock the full potential of your data visualization capabilities!
More Posts
How Mind Mapping Tools Elevate Project Management
Explore how mind mapping tools can elevate your project management process. Learn how these tools enhance workflow efficiency, improve team collaboration, and simplify complex project tasks. Whether you're planning, organizing, or tracking projects, discover the benefits of integrating mind mapping into your project management strategy.

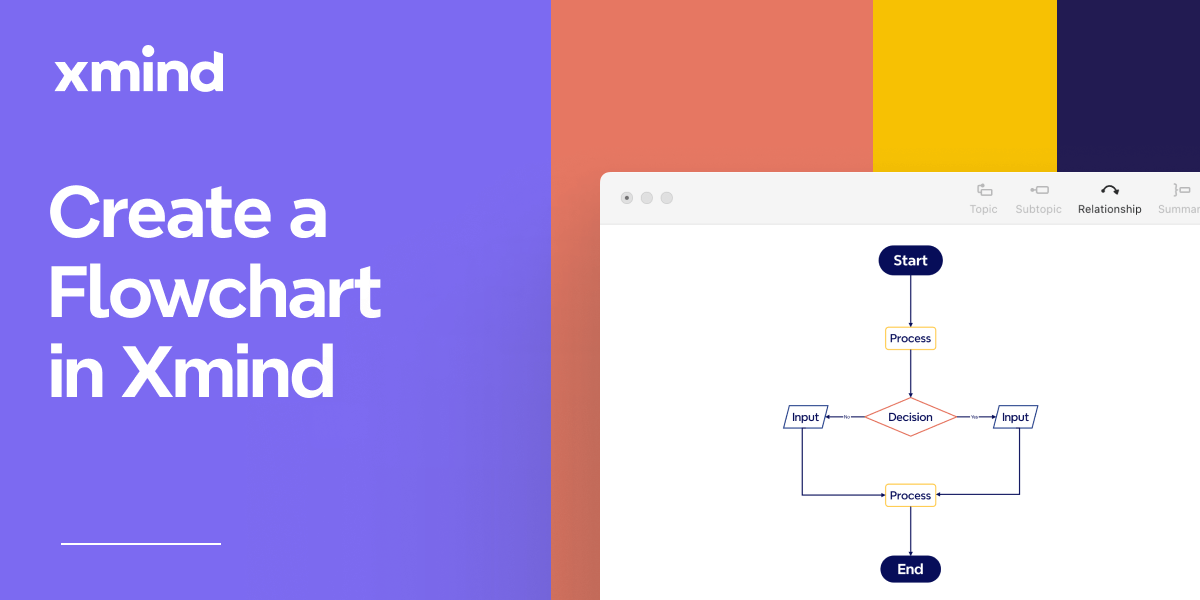
Flowchart Essentials: Definition, Templates, and Free Softwares
Discover the power of flowcharts with our detailed guide. Learn what a flowchart is, explore practical use cases, and discover how to create and optimize them using softwares like Xmind and Xmind AI for enhanced workflow efficiency.
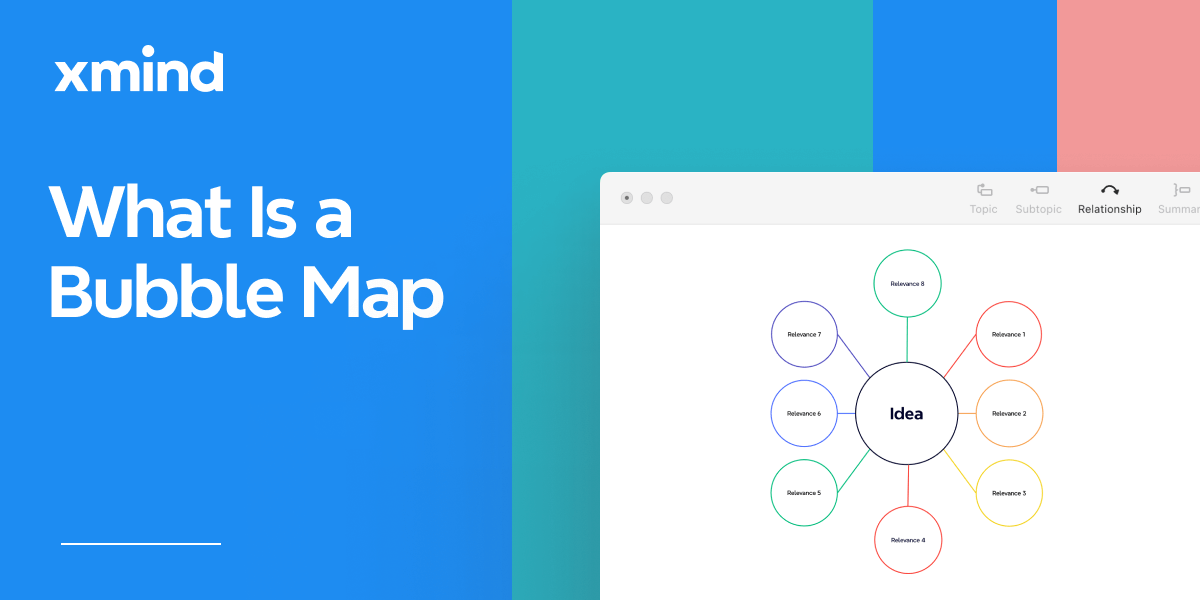
Bubble Maps: Definition, Examples, and How to Create in Xmind
Discover the power of bubble maps for data visualization with our comprehensive guide. Learn about different types, practical applications, and best mind mapping tools like Xmind. Get step-by-step instructions and expert tips to create stunning bubble maps for brainstorming, project management, and report writing.

One space for all your ideas
Organize thoughts, visualize structures, connect ideas, and unlock insights.
Get Started for Free